Thresholds
In many areas of the application, you can adjust thresholds to further filter or expand your search results.
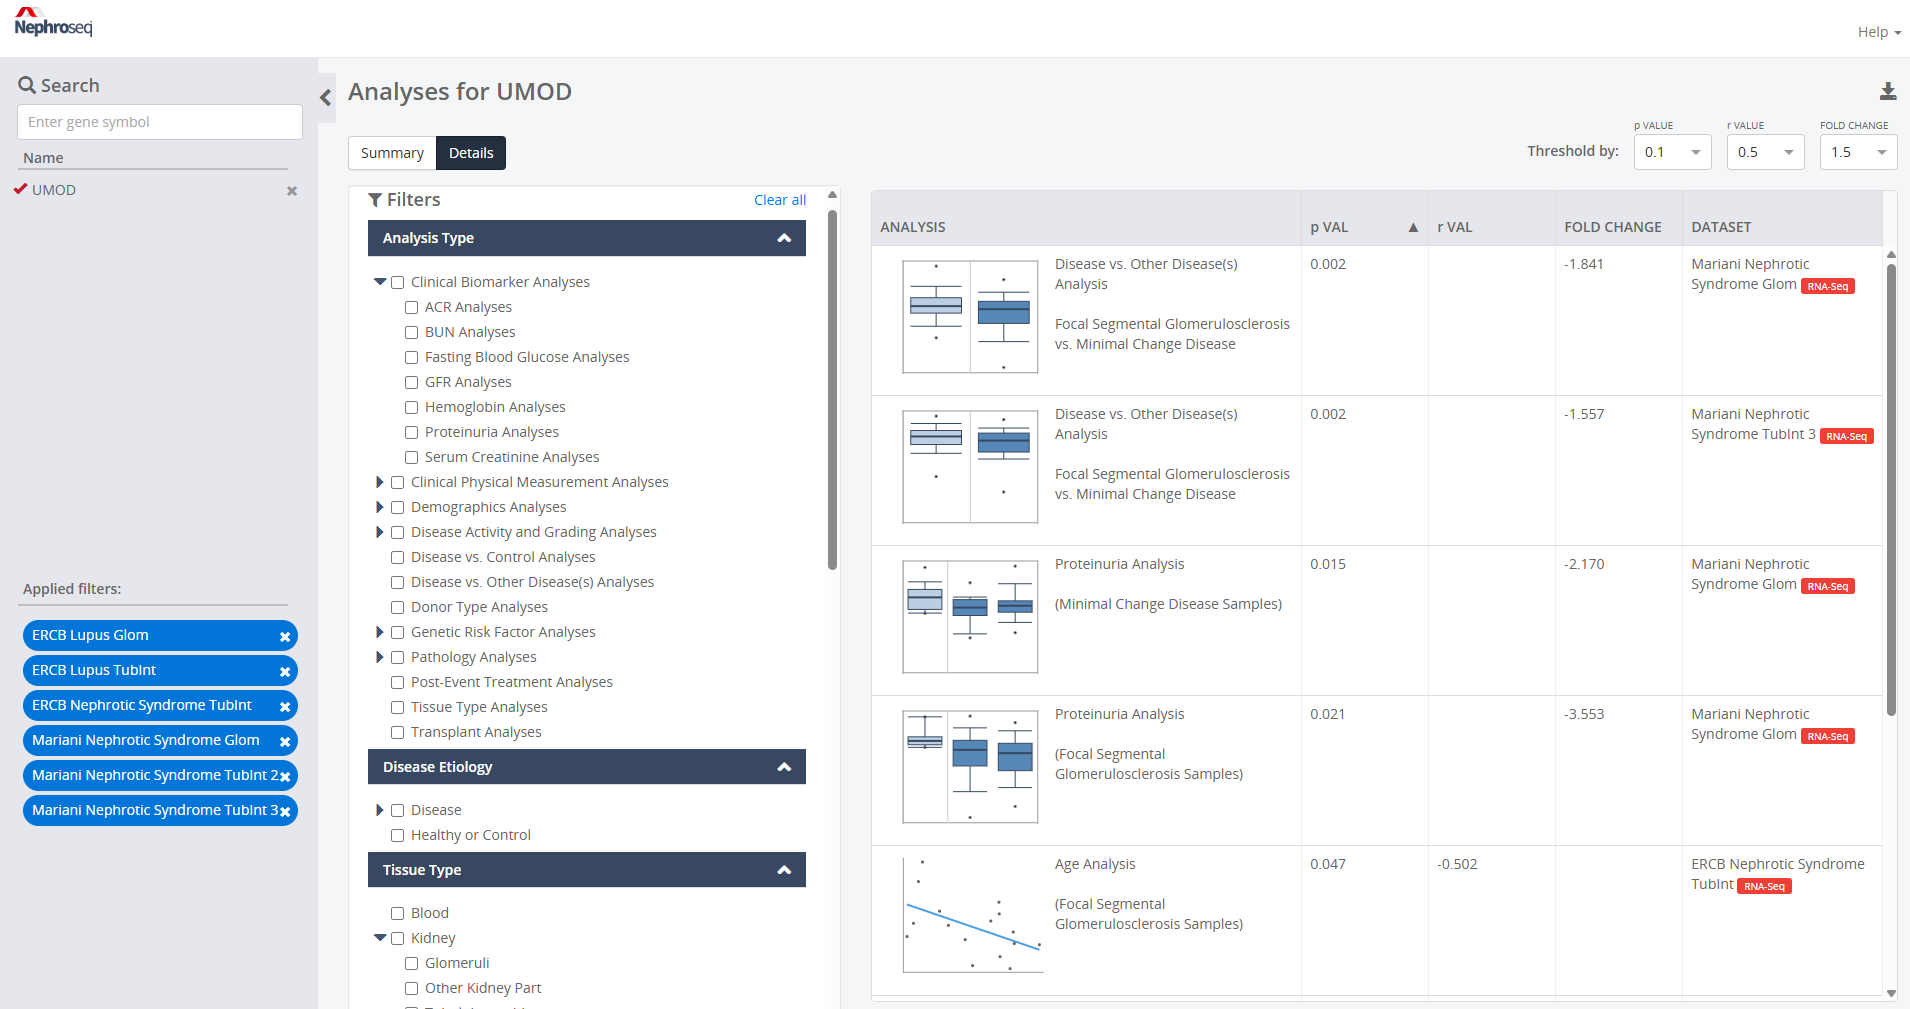
Statistical parameters at the top of the screen include thresholds for:
Fold Change: This threshold allows you to limit results to analyses where your gene's fold change was at or above a given number. Thresholds are in log fold change.
p-value: This threshold allows you to select a p-value cutoff, with lower p-values signifying greater statistical significance.
r-value: This threshold allows you to select values closer to +1 or -1, signifying a stronger relationship—positive for both variables increasing together, negative for one increasing as the other decreases, and values near 0 indicating little or no relationship. The r-value, while relevant for the scatterplots, is not relevant to the boxplot analyses and will appear as a blank in the filtered analysis table.
NOTE: If you lower the thresholds for fold change (e.g. to All), p-value (e.g. to 0.1), or r-value (e.g. to All), more analyses may appear in the available Analysis table to the right of the filters.
Thresholds are connected with the Boolean AND, meaning that Nephroseq will display analyses where your gene falls within your designated p-value.